Mean-Variance Plot for an Rpart Object
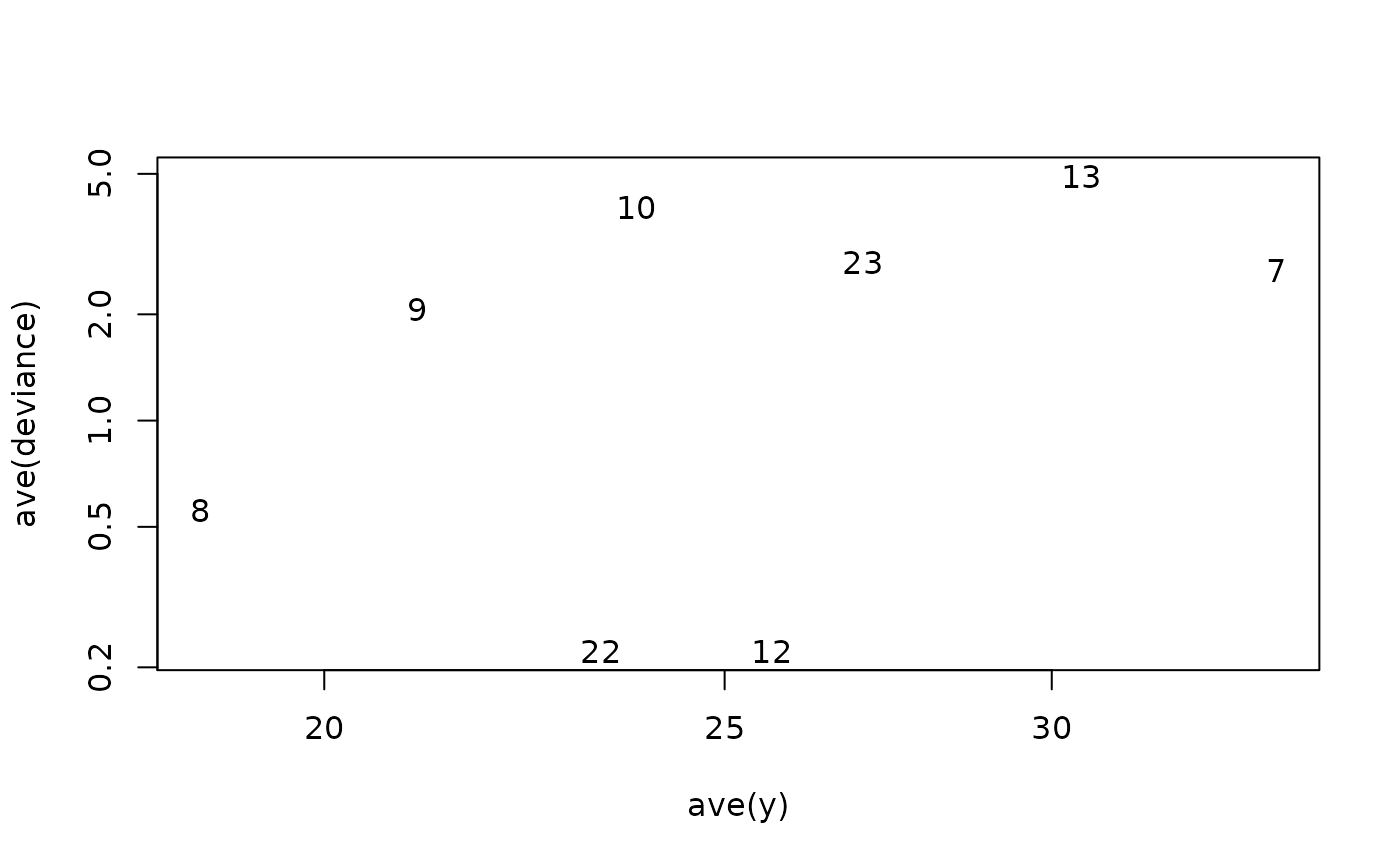
meanvar.rpart.RdCreates a plot on the current graphics device of the deviance of the node divided by the number of observations at the node. Also returns the node number.
Arguments
- tree
fitted model object of class
rpart. This is asumed to be the result of some function that produces an object with the same named components as that returned by therpartfunction.- xlab
x-axis label for the plot.
- ylab
y-axis label for the plot.
- ...
additional graphical parameters may be supplied as arguments to this function.
Value
an invisible list containing the following vectors is returned.
- x
fitted value at terminal nodes (
yval).- y
deviance of node divided by number of observations at node.
- label
node number.